ExCYT: A Graphical User Interface for Streamlining Analysis of High-Dimensional Cytometry Data
Abstract
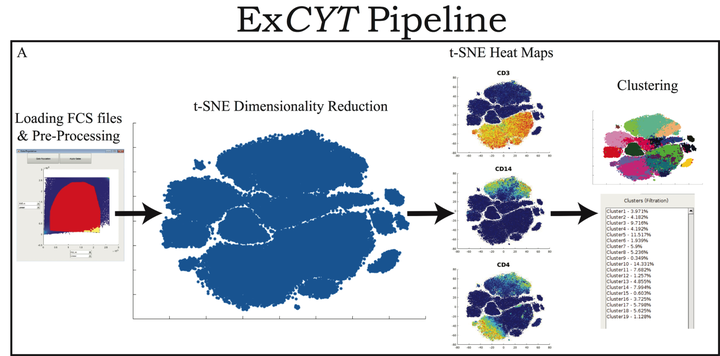
With the advent of flow cytometers capable of measuring an increasing number of parameters, scientists continue to develop larger panels to phenotypically explore characteristics of their cellular samples. However, these technological advancements yield high-dimensional data sets that have become increasingly difficult to analyze objectively within traditional manual-based gating programs. In order to better analyze and present data, scientists partner with bioinformaticians with expertise in analyzing high-dimensional data to parse their flow cytometry data. While these methods have been shown to be highly valuable in studying flow cytometry, they have yet to be incorporated in a straightforward and easy-to-use package for scientists who lack computational or programming expertise. To address this need, we have developed ExCYT, a MATLAB-based Graphical User Interface (GUI) that streamlines the analysis of high-dimensional flow cytometry data by implementing commonly employed analytical techniques for high-dimensional data including dimensionality reduction by t-SNE, a variety of automated and manual clustering methods, heatmaps, and novel high-dimensional flow plots. Additionally, ExCYT provides traditional gating options of select populations of interest for further t-SNE and clustering analysis as well as the ability to apply gates directly on t-SNE plots. The software provides the additional advantage of working with either compensated or uncompensated FCS files. In the event that post-acquisition compensation is required, the user can choose to provide the program a directory of single stains and an unstained sample. The program detects positive events in all channels and uses this select data to more objectively calculate the compensation matrix. In summary, ExCYT provides a comprehensive analysis pipeline to take flow cytometry data in the form of FCS files and allow any individual, regardless of computational training, to use the latest algorithmic approaches in understanding their data.