Introduction
The origin of this project began out of several of my colleagues asking for my help in analyzing their flow cytometry data. As I found myself writing code and doing analyses for them, I realized that I would like to be able to create a way for others who did not have significant coding experience to be able to do the analyses (i.e. dimensionality reduction, clustering, etc) that I was routinely doing for several groups. Out of that desire was born the ExCYT software, a MATLAB-based graphical user interface (GUI) to do state-of-the-art high-dimensional cytometry analysis.
Abstract
With the advent of flow cytometers capable of measuring an increasing number of parameters, scientists continue to develop larger panels to phenotypically explore characteristics of their cellular samples. However, these technological advancements yield high-dimensional data sets that have become increasingly difficult to analyze objectively within traditional manual-based gating programs. In order to better analyze and present data, scientists partner with bioinformaticians with expertise in analyzing high-dimensional data to parse their flow cytometry data. While these methods have been shown to be highly valuable in studying flow cytometry, they have yet to be incorporated in a straightforward and easy-to-use package for scientists who lack computational or programming expertise. To address this need, we have developed ExCYT, a MATLAB-based Graphical User Interface (GUI) that streamlines the analysis of high-dimensional flow cytometry data by implementing commonly employed analytical techniques for high-dimensional data including dimensionality reduction by t-SNE, a variety of automated and manual clustering methods, heatmaps, and novel high-dimensional flow plots. Additionally, ExCYT provides traditional gating options of select populations of interest for further t-SNE and clustering analysis as well as the ability to apply gates directly on t-SNE plots. The software provides the additional advantage of working with either compensated or uncompensated FCS files. In the event that post-acquisition compensation is required, the user can choose to provide the program a directory of single stains and an unstained sample. The program detects positive events in all channels and uses this select data to more objectively calculate the compensation matrix. In summary, ExCYT provides a comprehensive analysis pipeline to take flow cytometry data in the form of FCS files and allow any individual, regardless of computational training, to use the latest algorithmic approaches in understanding their data.
Overview
In this post, I’ll briefly go over aspects of the software. A full demonstration including video can be found within the JoVE publication.
Graphical User Interface (GUI)
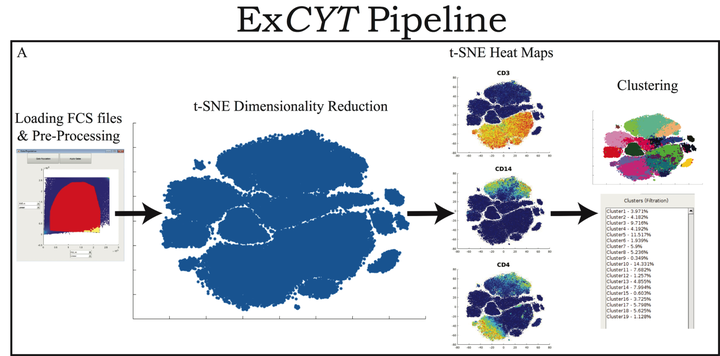
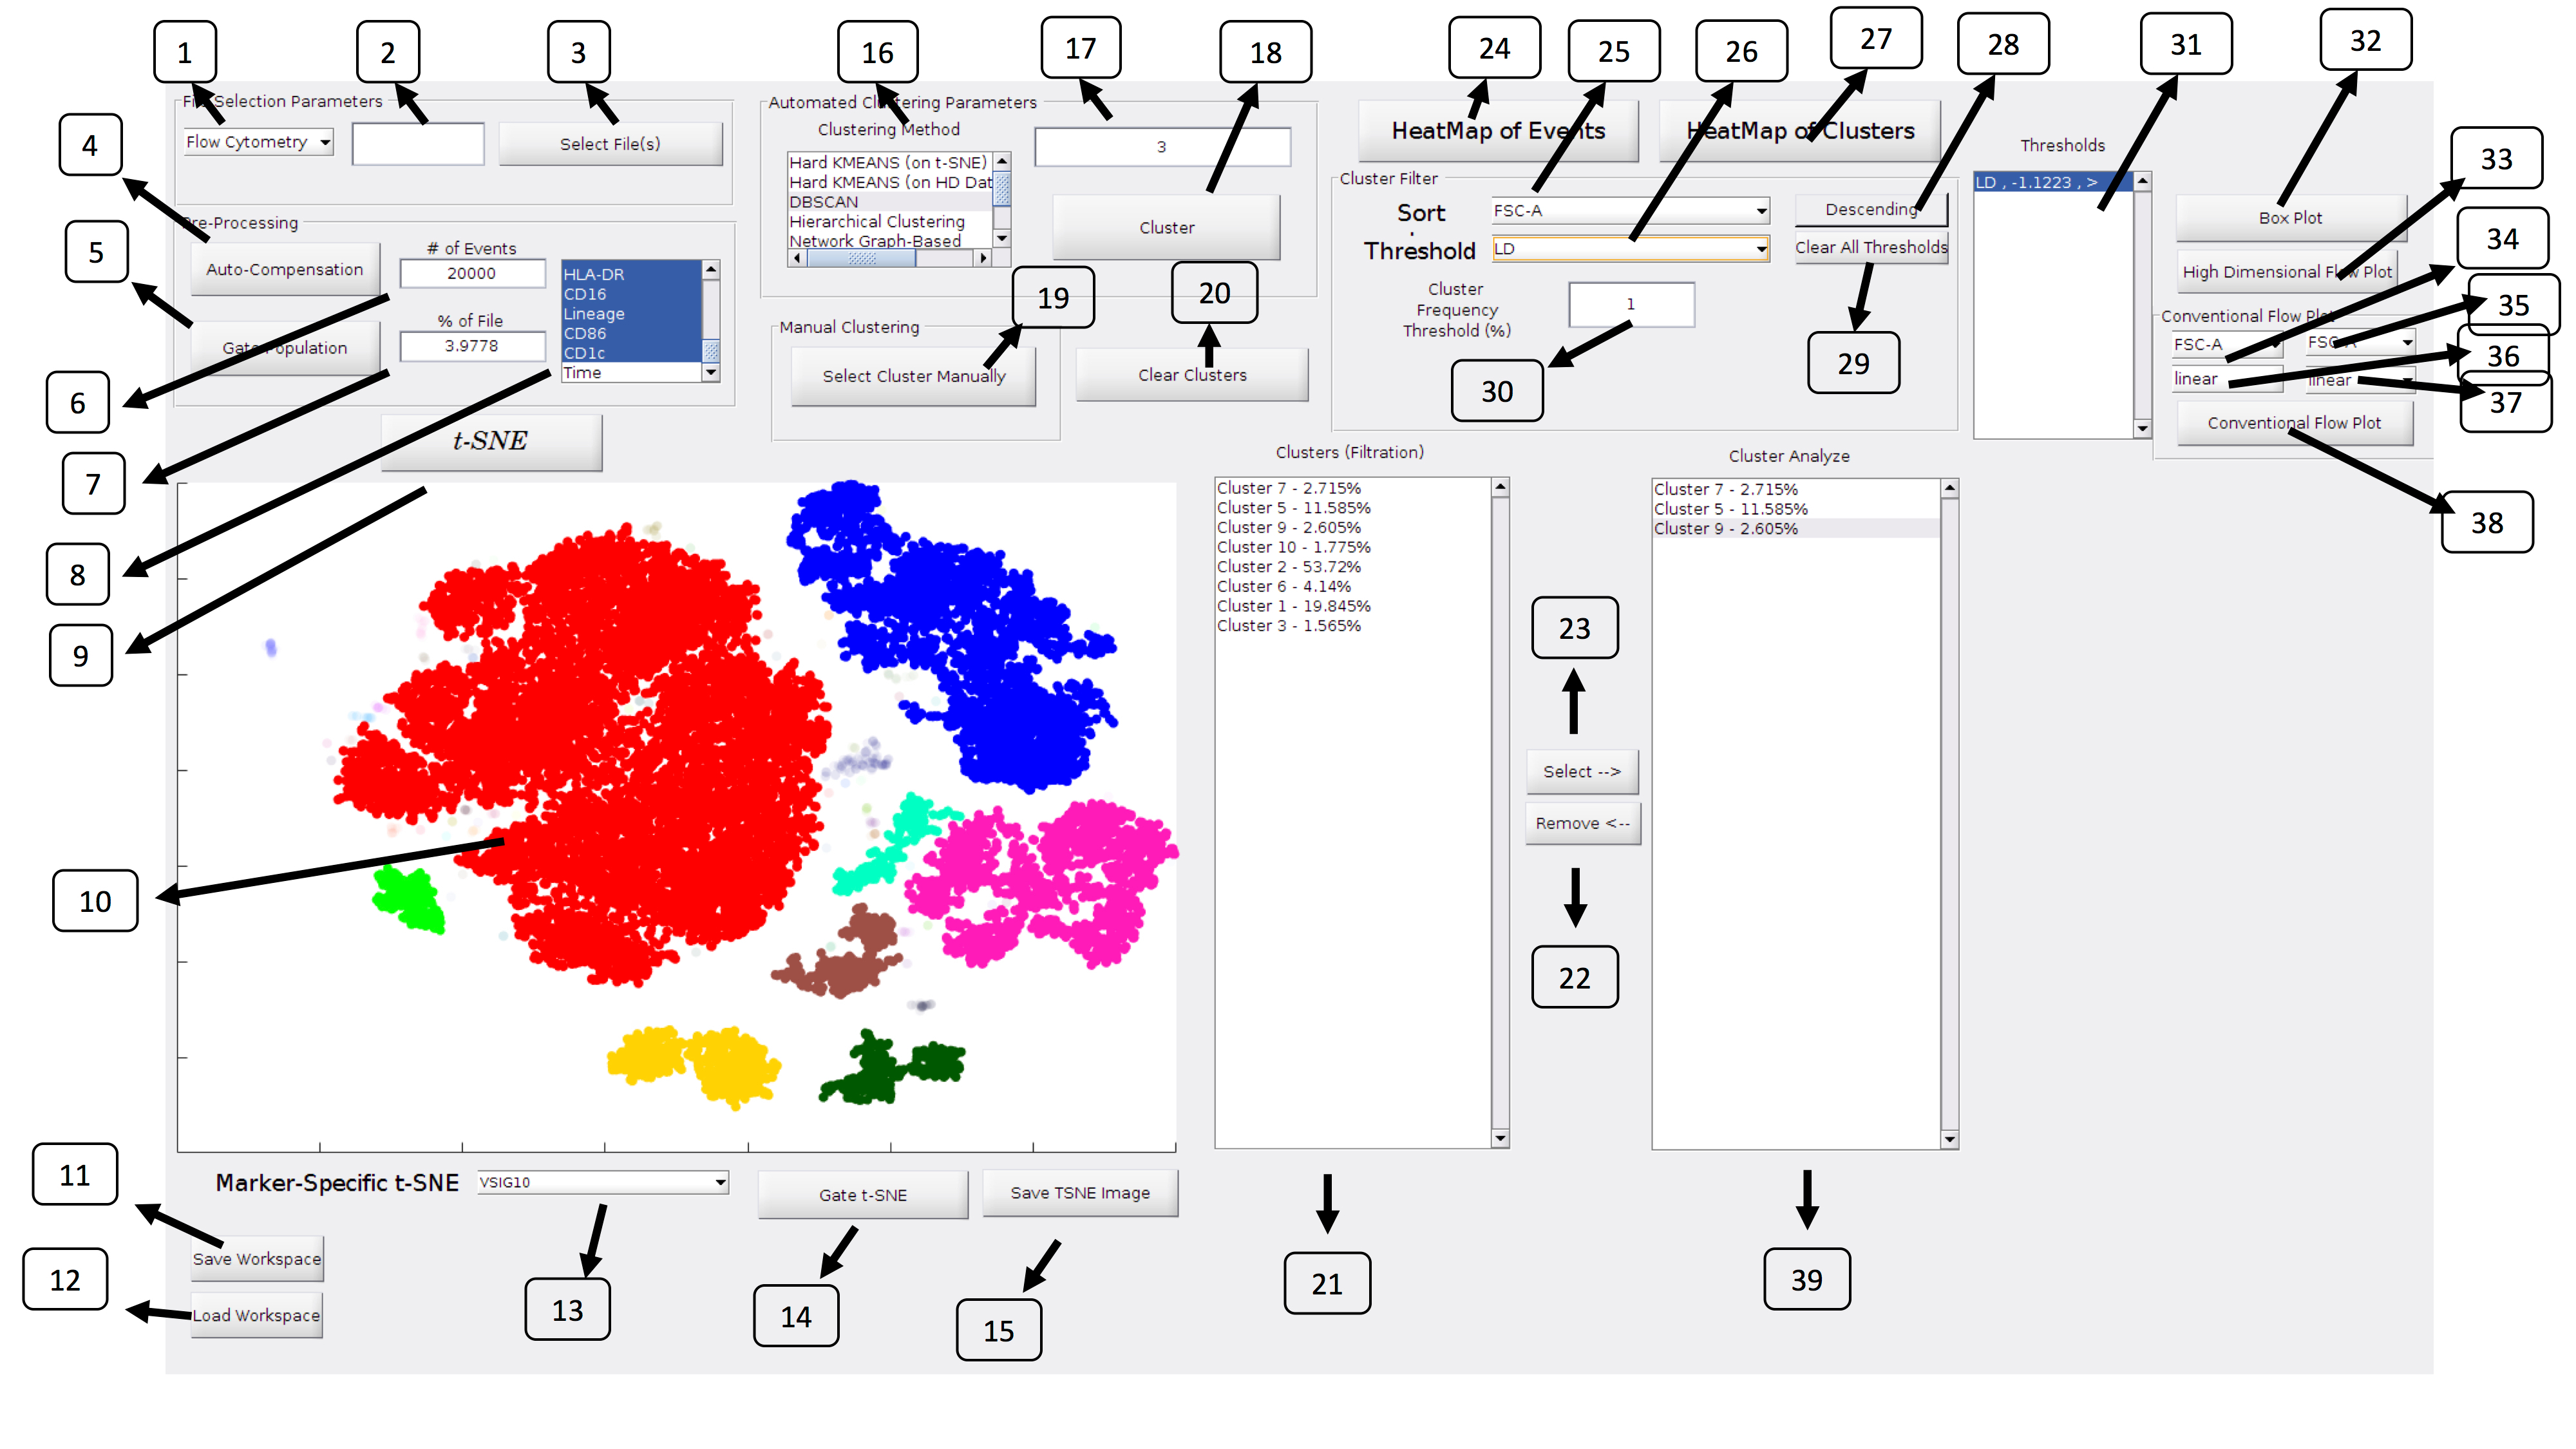
The graphical user interface allows all the analysis from top to bottom to be done within a single window. This allows everything from pre-processing, auto-compensation, dimensionality reduction via tSNE, clustering via multiple methods, along with a variety of ways to visualize the results.
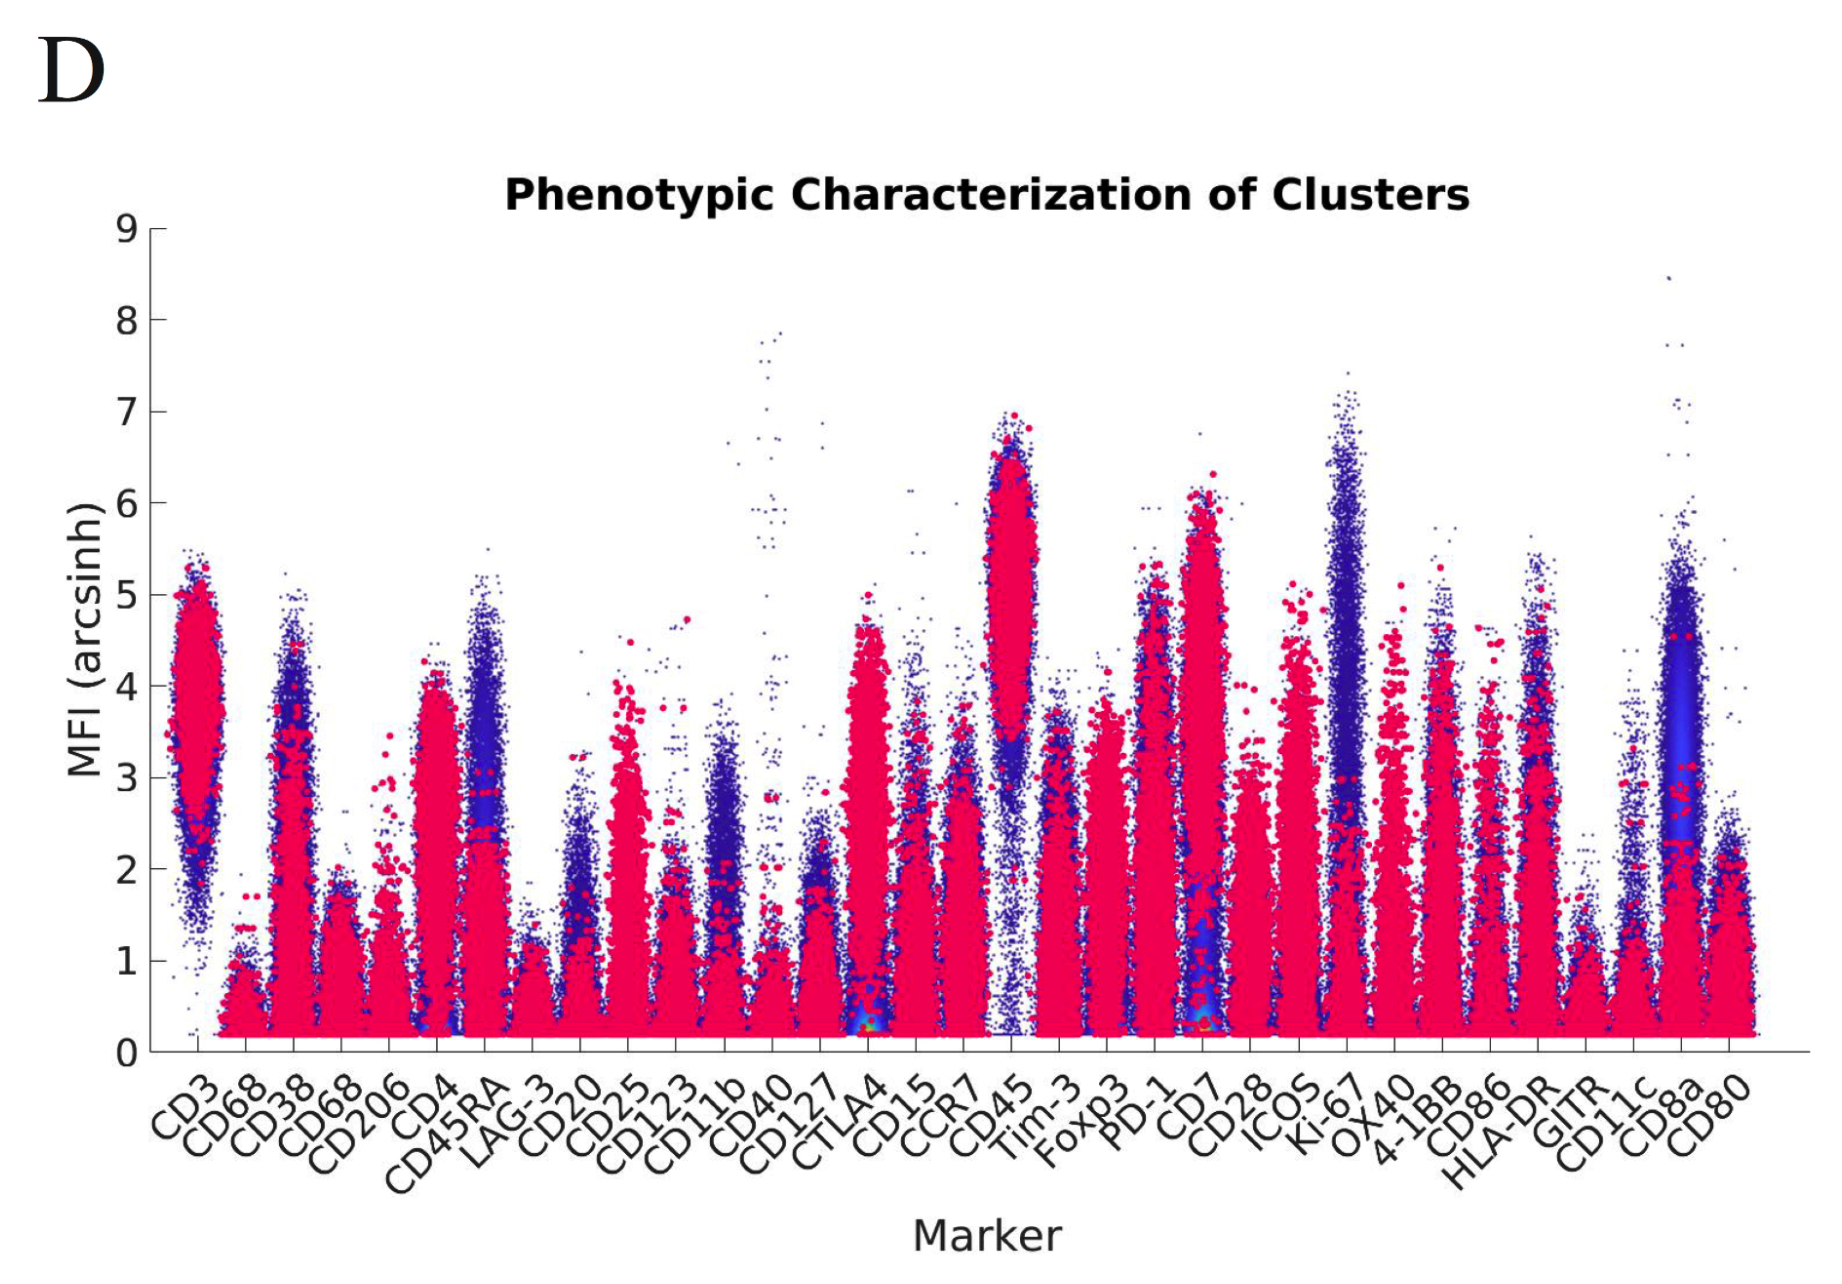
While many of these methods are well-established, the one feature I added which I have found individuals have enjoyed using are these high-dimensional flow plots which allow one to see the phenotypic characterization of a given cluster within the background distribution across all channels. I find these plots particularly helpful because in many cases, the distributions of these channels can be either uni or bi-modal. The interpretation of a cluster’s MFI for a given channel should be interpreted within the distribution of all cells within this channel and this method of visualization allows one to do that.
To date, ExCYT has been used by several publications including:
- Song, N., et. al. Multiple genetic programs contribute to CD4 T cell memory differentiation and longevity by maintaining T cell quiescence. (2020) Cellular Immunology
- Theodros. D., et. al. High-Dimensional Cytometry (ExCYT) and Mass Spectrometry of myeloid infiltrate in clinically localized clear cell Renal Cell Carcinoma identifies novel potential myeloid targets for immunotherapy. (2020) Molecular & Cellular Proteomics
- Ma, H., et. al. A CD40 Agonist and PD-1 Antagonist Antibody Reprogram the Microenvironment of Nonimmunogenic Tumors to Allow T-cell–Mediated Anticancer Activity. (2019) Cancer Immunology Research
ExCYT 2
There also exists a beta-version of ExCYT2 which allows for multi-sample/multi-cohort comparative analyses. The main change in the workflow from ExCYT to ExCYT2 is that following the importation of the fcs files, one can use the Assign button to assign files to cohorts for comparative analyses.